New Study Maps Migraine Symptoms Across Attack Phases
Posted on September 03 2024,

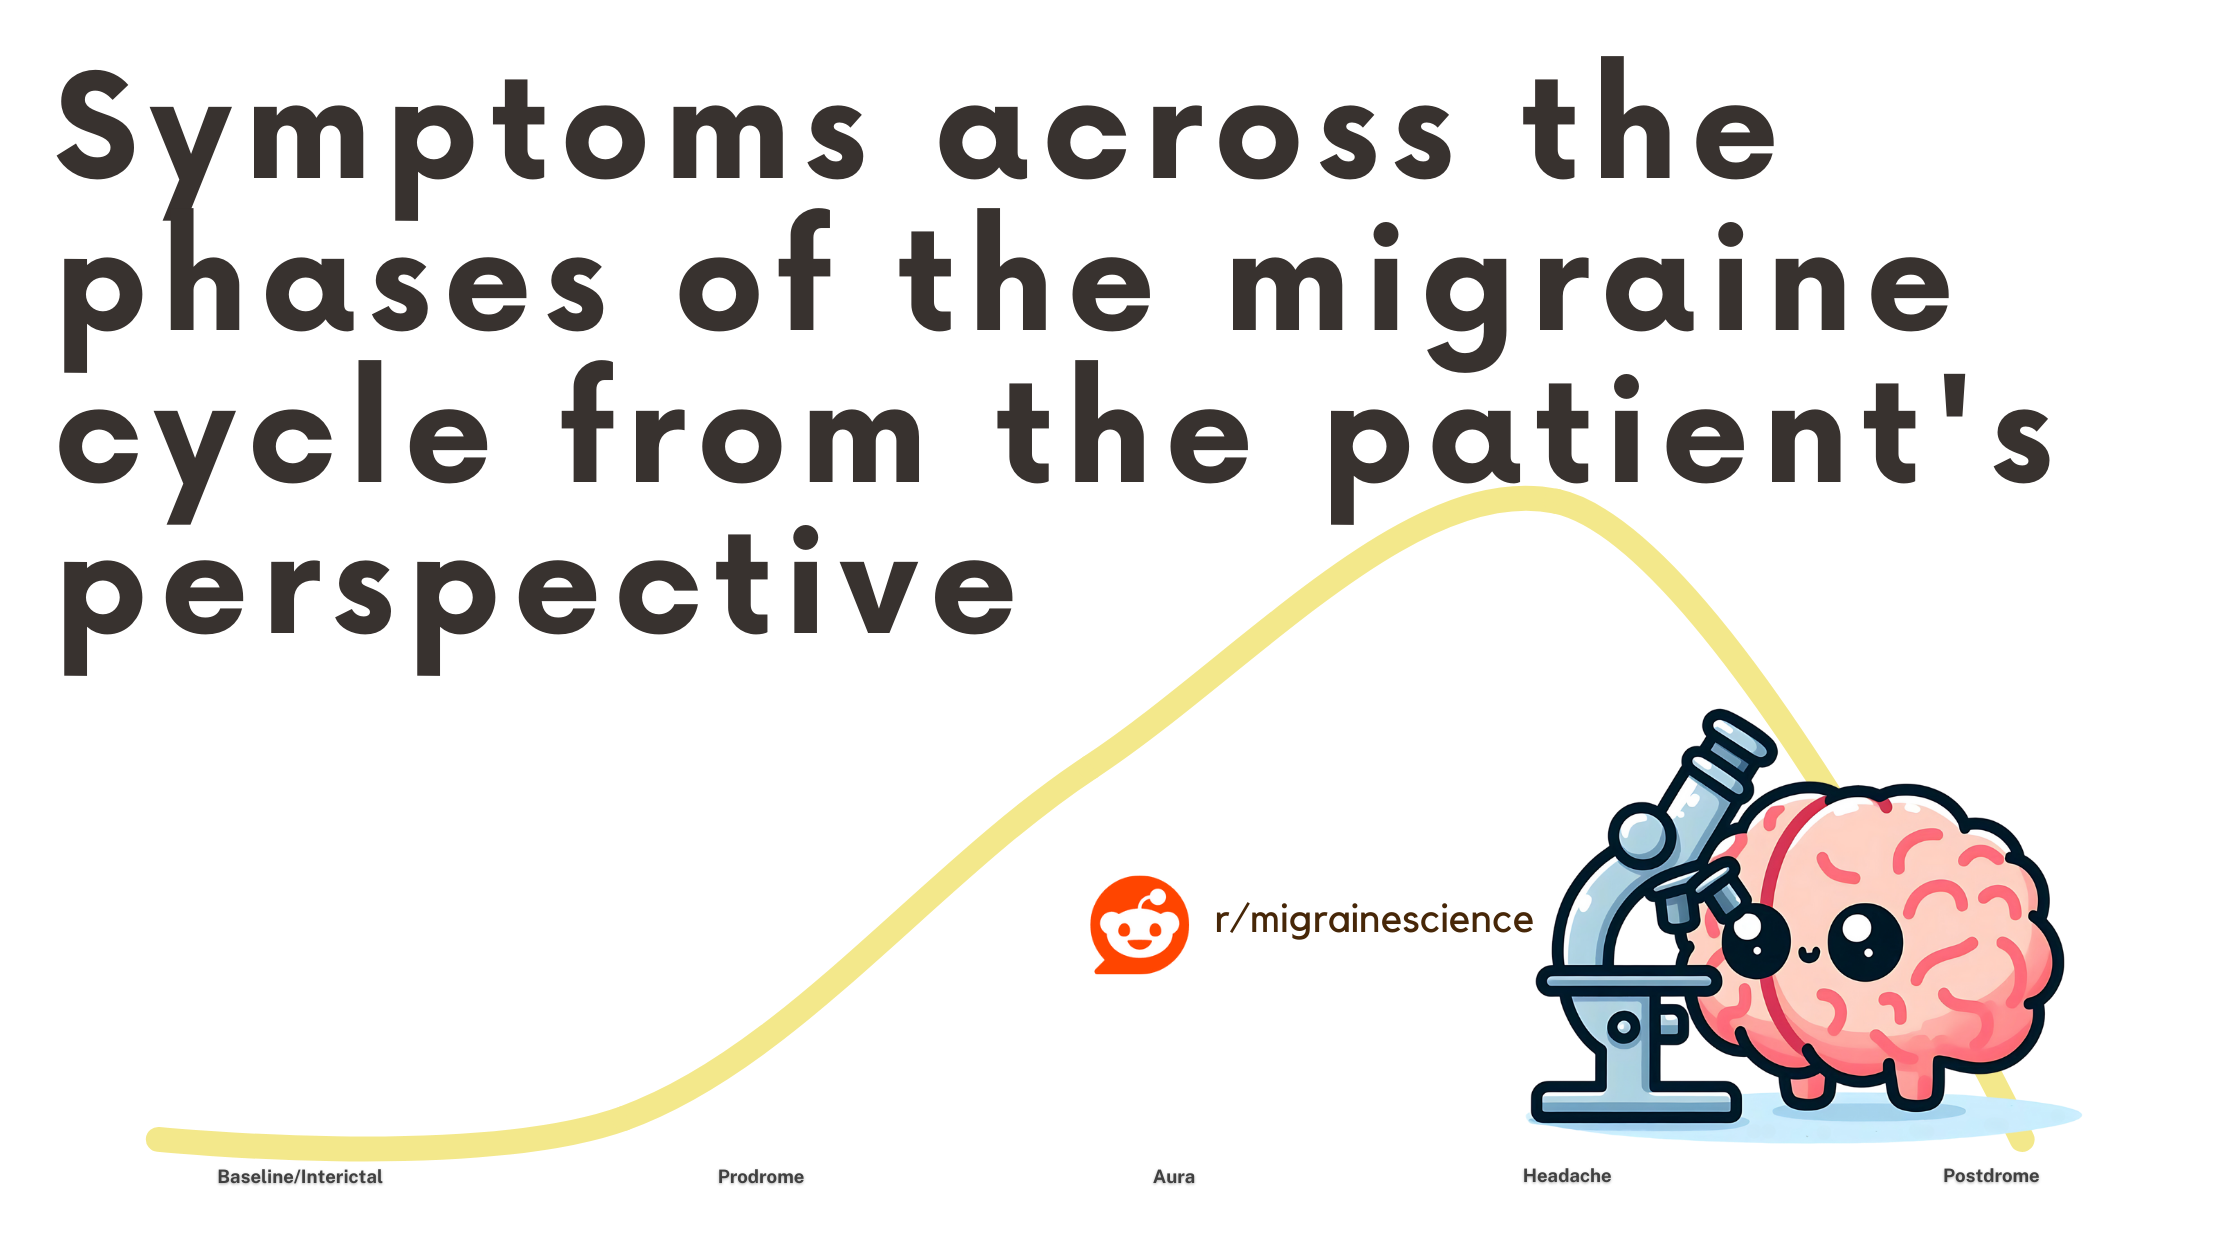
Migraine Symptoms Across All Phases
Key Insights
- Fatigue peaks post-headache: 68% experience fatigue after the headache phase, making it the most common post-headache symptom
- Anxiety is highest between attacks: 30% report anxiety during interictal periods, more than during active migraine phases
- Visual changes signal onset: 53% experience visual symptoms in the pre-headache phase, making them important early warning signs
- Relief is exclusive: 60% experience relief only during the post-headache phase
| Symptom | Pre-headache* | Headache* | Post-headache* | Interictal* | Pooled %** | Notes |
|---|---|---|---|---|---|---|
| Head pain | 50% | 100% | 28% | 5% | 100% | Only universally reported symptom; defining feature of headache phase |
| Light sensitivity | 75% | 80% | 30% | 13% | 93% | Second most common symptom; persists across all phases |
| Nausea | 63% | 63% | 15% | 13% | 88% | Equally prevalent in pre-headache and headache phases |
| Irritableness | 60% | 65% | 25% | 0% | 83% | Most common mood symptom; not reported in interictal phase |
| Sound sensitivity | 60% | 60% | 25% | 8% | 80% | Consistent across pre-headache and headache phases |
| Fatigue | 40% | 28% | 68% | 10% | 80% | Most common in post-headache phase; may limit daily function |
| Depression | 35% | 50% | 30% | 18% | 65% | Present in all phases; peaks during headache phase |
| Anxiety | 40% | 23% | 23% | 30% | 60% | Most common interictal symptom; highest in pre-headache phase |
| Relief | 0% | 0% | 60% | 0% | 60% | Unique to post-headache phase |
| Appetite changes | 33% | 23% | 38% | 0% | 58% | Most common in post-headache phase; includes both increased and decreased appetite |
| Visual changes | 53% | 30% | 5% | 5% | 55% | Most common in pre-headache phase; includes blurred vision, eye floaters, vision loss |
| Numbness | 43% | 28% | 5% | 3% | 55% | Most prevalent in pre-headache phase |
| Smell sensitivity | 40% | 35% | 8% | 3% | 50% | Most common in pre-headache and headache phases |
| Other pain | 20% | 35% | 15% | 10% | 48% | Includes neck, back, and body pain; most common during headache phase |
| Insomnia | 33% | 18% | 3% | 8% | 48% | Most common in pre-headache phase |
| Tension | 43% | 10% | 5% | 3% | 45% | Most common in pre-headache phase; includes head, neck, shoulder tension |
| Touch sensitivity | 25% | 23% | 8% | 0% | 38% | Most prevalent in pre-headache and headache phases |
| Aura | 33% | 13% | 3% | 0% | 35% | Most common in pre-headache phase; not reported in interictal phase |
| Anger | 20% | 15% | 8% | 15% | 35% | Present in all phases; most common in pre-headache phase |
| Vertigo | 20% | 30% | 15% | 13% | 33% | Includes dizziness and imbalance; most common during headache phase |
| Euphoria | 3% | 3% | 28% | 5% | 33% | Most common in post-headache phase; likely related to relief |
| Cranial autonomic symptoms | 23% | 15% | 0% | 3% | 30% | Most common in pre-headache phase |
| Vomiting | 5% | 28% | 0% | 0% | 28% | Predominantly occurs during headache phase |
| Weakness | 28% | 20% | 13% | 0% | 40% | Most common in pre-headache phase; not reported in interictal phase |
| Coordination difficulty | 20% | 5% | 3% | 5% | 20% | Most common in pre-headache phase |
| Guilt | 0% | 13% | 8% | 5% | 15% | Not reported in pre-headache phase; most common during headache |
| Thirst | 0% | 0% | 8% | 0% | 8% | Only reported in post-headache phase |
| Diarrhea | 0% | 3% | 3% | 3% | 8% | Low prevalence across headache, post-headache, and interictal phases |
| Tinnitus | 5% | 3% | 0% | 0% | 8% | Rare; only reported in pre-headache and headache phases |
| Tremor | 0% | 3% | 3% | 0% | 3% | Least common symptom; only reported in headache and post-headache phases |
*Phase-specific percentages: These percentages represent the proportion of participants who reported experiencing the symptom during that specific phase of the migraine cycle. For example, 50% in the "Pre-headache" column for head pain means that half of the participants reported experiencing head pain during the pre-headache phase.
**Pooled %: The pooled percentage represents the proportion of participants who reported experiencing the symptom in at least one of the four phases. It does not necessarily equal the sum of the phase-specific percentages, as a participant might experience a symptom in multiple phases but would only be counted once in the pooled percentage.
Data source: Headache: The Journal of Head and Face Pain
Wed, Jan 14, 26
New Emergency Department Migraine Treatment Guidelines
The American Headache Society (AHS) has released its 2025 guideline update for the acute treatment of migraine in adults presenting to the emergency department. This update, published in Headache in...
Read MoreSun, Jan 04, 26
Long-Term Safety of Anti-CGRP Monoclonal Antibodies
A comprehensive meta-analysis of over 4,300 patients reveals that erenumab, galcanezumab, fremanezumab, and eptinezumab maintain good tolerability beyond 12 months. Only 3% of patients stopped treatment due to adverse events,...
Read MoreThu, Jan 01, 26
Alternate Nostril Breathing Protocol for Migraine
Alternate nostril breathing is a simple yogic technique that's showing real promise for migraine prevention. Unlike acute treatments, this practice builds nervous system resilience over time - making attacks less...
Read More


